Categories: Programming
A very quick intro to GraphViz and Dot.
Dot is a text-file format in which you define nodes and edges between nodes. The dot application (part of the graphviz suite of applications) then takes this file and generates an image in any of multiple formats:
- SVG (scalable vector graphics)
- PNG
- and others
There is a pretty nice user’s document available on the Graphviz site; this article just gives a quick intro.
Note that when talking about “graphs” here, “directed graphs” are meant, not numerical graphs. In other words, GraphViz/Dot draw diagrams of nodes-and-edges not line-graphs or pie-charts.
To install on Ubuntu:
sudo apt install graphviz
A simple example file:
digraph "mygraph" {
  node [shape="box",style="rounded",fontname="Helvetica",fontsize="14"]
  edge [fontsize="10",fontname="Helvetica"]

  // Node Definitions
  "nodeid1"[label=<Node N1>]
  "nodeid2"[label=<Node N2>]
  "nodeid3"[label=<Node N3>]

  { // subgraph
    rank=min
    "rootnode"[label=<Initial Node>]
  }

  { // subgraph
    rank=same
    "peer1"[label=<Peer Node 1>]
    "peer2"[label=<Peer Node 2>]
  }

  { // subgraph
    rank=max
    "termnode"[label=<Terminal Node>]
  }

  // Edge Definitions
  "rootnode" -> "nodeid1"
  "rootnode" -> "nodeid2"
  "rootnode" -> "nodeid3"
  "nodeid1" -> "peer1"
  "nodeid2" -> "peer2"
  "nodeid3" -> "peer2"
  "peer1" -> "termnode" [weight=5]
  "peer2" -> "termnode"
}
The symbol -> indicates a directional relation; symbol -- indicates a non-directional relation.
Multiple definitions can be placed on the same line by separating them with semicolons, eg node1;node2;node3.
Quotes are optional around a single “atom”, and labels are optional (node name is used).
Running dot:
dot -Tsvg -o mygraph.svg mygraph.dot
eog mygraph.svg  # or any other suitable viewing app
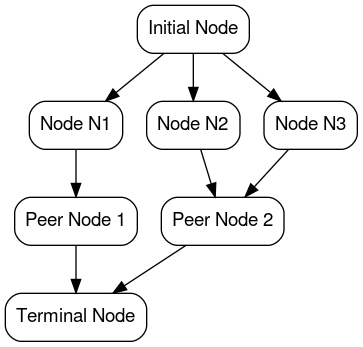
And the result:

Dot’s layout mechanism works with DAGs (directed acyclic graphs) only; a graph with cycles is first converted to a DAG by invisibly “reversing” some edges (based on heuristics). You can give hints to dot about where to break cycles in various ways (hidden edges, weights, etc).
Given a DAG, dot lays out the graph by first choosing a “rank” for each node, ie what “layer” (from top to bottom or left to right) each node should be assigned to. A referencing node is always given a lower rank than any node it references - but the algorithm may assign a node a lower-than-necessary rank if this simplifies the interconnection lines. The placement of nodes within a rank (first to last) and the layout of interconnecting lines is then done to produce a “good looking” result - as far as dot can estimate that.
By defining a set of nodes together in a “subgraph” and marking the subgraph with a “rank” category the layout can be forced to “align” nodes in a limited way:
- rank=min pushes all the associated nodes to the “top” (or left) layer of the diagram
- rank=max pushes all the associated nodes to the “bottom” (or right) layer of the diagram
- rank=same lets dot decide where to place them, but all nodes in the set are aligned (vertically or horizontally depending on graph layout)
Note that an explicit rank-number cannot be assigned; just min/max/same (plus options source and sink; see docs).
The “weight” attribute of an edge can be used to influence how near to each other two nodes should be placed; nodes with an “important relationship” can be assigned a weight higher than the default (1). Alternatively, the “group” attribute can be used on nodes with an “important relationship”, eg [group=processors].
The graphviz package actually provides a suite of different tools and layout engines; dot is an “extensible framework” that can be tweaked to produce many different types of output. See the official website or the many online tutorials for a full description.
There does not seem to be any useful “graphical editor” for dot files at the current time. There are half-a-dozen semi-broken and abandoned projects, and a few tools which don’t offer much more than a text-editor with dot-syntax-checking. However they aren’t necessary; dot files use a syntax that is pretty easy to edit manually.


